
The dashboards that survive past initial launch are the ones that connect AI visibility to pipeline. That observation comes from NAV43's work building AEO reporting infrastructure for B2B companies in 2026, and it describes the failure mode that kills more AI search visibility programs than poor citation rates: a leadership team that looked at the dashboard once, saw citation frequencies they did not know how to act on, and never opened it again.
The problem is not that leadership does not care about AI search. 94% of CMOs plan to increase AEO/GEO investment in 2026. The problem is that a dashboard full of citation rates and share-of-voice metrics with no connection to business outcomes reads as a marketing vanity metric display, which is exactly what most AI visibility dashboards are.
What Belongs in an AI Search Visibility Dashboard
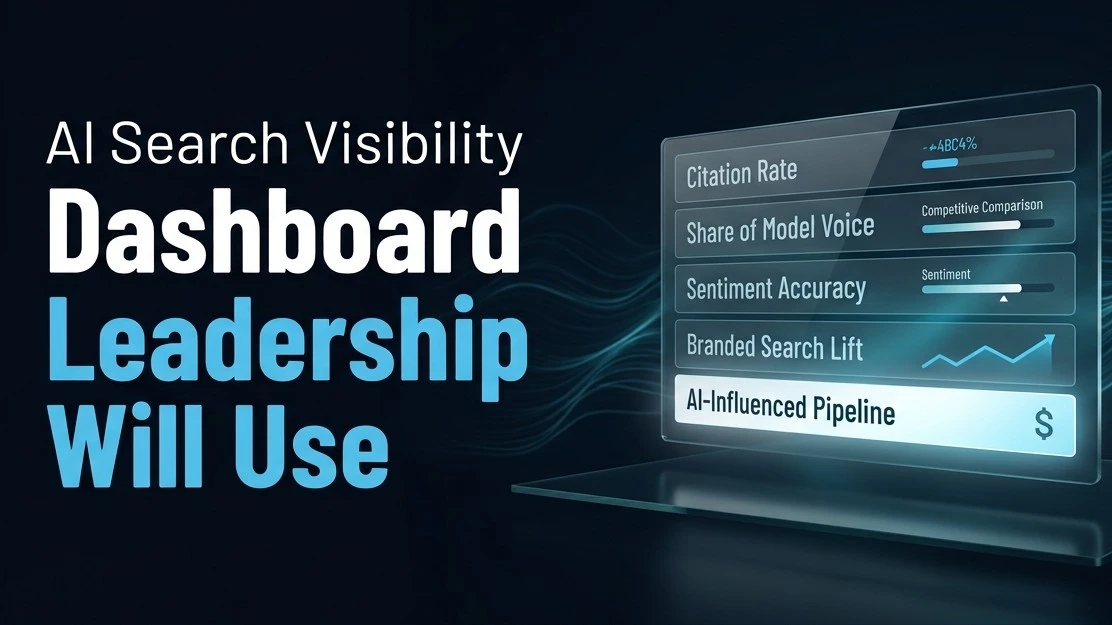
Five metrics, tracked at cadences matched to how fast the underlying signals actually move, connected to at least one business outcome. Everything else is noise until you have the foundation running cleanly.
- AI Citation Rate. How often your brand appears when you run your priority prompt set across ChatGPT, Perplexity, Google AI Overviews, and Claude. This is the foundational metric. Track it per platform, per prompt category, and as a composite. Benchmark for B2B categories in 2026: 8 to 15% is a reasonable starting baseline, 20 to 30% signals optimized content gaining traction, 40% or higher is category leadership. The problem with presenting this metric alone to leadership is that a 15% citation rate means nothing without knowing whether that is above or below competitors and what the gap costs in pipeline terms.
- Share of Model Voice. Your citation count as a percentage of all brand citations across all vendors mentioned for your priority prompt set. ChatGPT alone drives 87.4% of all AI referrals per Conductor's 2026 benchmarks, which means Share of Model Voice on ChatGPT specifically is the competitive metric that matters most for most B2B categories. If a competitor sits at 45% share of voice and you are at 9%, you have a clear gap and a clear target. This is the metric that answers the QBR question "how do we compare."
- Citation Sentiment and Accuracy. Whether AI platforms describe your brand correctly and positively when they do cite you. This is more important than citation rate for companies whose AI description is inaccurate, outdated, or consistent with a positioning they have moved away from. An AI model that consistently describes you as a "startup-focused" tool when you now serve enterprise accounts is actively damaging your pipeline, not building it, and that damage is invisible in citation frequency data. Track this quarterly with a human review of 20 to 30 sampled AI outputs across your priority queries.
- Branded Search Volume Lift. Monthly change in branded search queries in Google Search Console. AI citations do not always produce direct clicks, major publishers receive under 1% of referral traffic from AI platforms despite being frequently cited. What they do produce is brand awareness that converts to branded search later. When your AI citation rate increases, branded search volume should follow within 30 to 60 days. Tracking the correlation between citation rate changes and branded search volume changes is the leading indicator that connects AI visibility to buyer behavior without requiring direct attribution.
- AI-Influenced Pipeline. Deals in your CRM where at least one contact at the buying account was in your AI-visible audience, defined by whether they ran queries in the topic clusters you are being cited for. This requires either survey data ("How did you first hear about us?") or intent data from tools that track AI search behavior at the account level. It is the hardest metric to capture cleanly and the most important one for earning a standing agenda item. Revenue Visibility Gap, estimated revenue at risk from absent AI citations in key query categories, is an alternative formulation that advanced teams track as a standard quarterly metric.
The Cadence Problem Most Dashboards Get Wrong
AI citations change at 40 to 60% per month across platforms. Google AI Overviews show 59% citation drift, ChatGPT 54%, Copilot 53%, Perplexity 40%. A weekly spot check of five prompts is not a reliable signal of your actual citation position. A monthly run of 50 to 100 priority prompts across the three to four highest-priority platforms produces a directional trend that is meaningful.
The mistake is presenting weekly snapshots to leadership as if they reflect the actual state of your AI visibility. They do not. They reflect a probabilistic sample from a volatile system. Present monthly trends and quarterly averages. Flag anomalies that hold across two consecutive monthly measurements rather than overreacting to single-period swings.
The tracking stack does not need to be sophisticated to start. Manual prompt testing in a spreadsheet, run your priority prompt set across each engine monthly, log which prompts cite you and how you are described, calculate citation rate and share of voice, is more defensible than an expensive tool that produces metrics you cannot explain to leadership. The tool layer adds value when you are tracking more than 50 prompts across more than three platforms. Below that threshold, a structured spreadsheet with a consistent methodology works.
Building the Pipeline Connection
The dashboard that earns a standing QBR agenda item connects three numbers in sequence: citation rate or share of voice in our priority query categories, branded search volume trend, AI-influenced pipeline as a percentage of total pipeline this quarter.
The narrative that works: "Our AI citation rate in [category query cluster] increased from 12% to 27% over the last quarter. Branded search for [Company Name] increased 34% in the same period. Three of the eight new deals closed this quarter had buying team members who we can confirm were researching [category] in AI platforms before their first call with sales."
That is a story leadership can evaluate and act on. A slide showing citation rates across five platforms with no pipeline connection is a marketing reporting exercise that will get skipped in the next QBR.
What to Track by Company Stage
For companies just starting AI visibility tracking, three metrics are sufficient: composite citation rate across your top 20 prompts, share of model voice on ChatGPT specifically, and branded search volume trend. This takes one person approximately four hours per month and produces a directional signal that is enough to prioritize content investment decisions.
For companies six to twelve months into a structured AEO program, add sentiment and accuracy tracking via quarterly manual review, and begin building the AI-influenced pipeline signal through self-reported attribution fields in your demo request and contact forms ("How did you first hear about us?" with an option for "AI search or ChatGPT").
For companies with a mature program, the Revenue Visibility Gap metric, calculated by modeling the estimated pipeline value of being cited at category-leading citation rates for your highest-commercial-intent queries versus your current citation rate, is the board-level metric that quantifies what the AEO investment is protecting and generating.
Frequently Asked Questions
What is an AI search visibility dashboard for B2B marketing teams?
An AI search visibility dashboard is a reporting framework that tracks how often and how accurately a brand appears in AI-generated answers across ChatGPT, Perplexity, Google AI Overviews, and other platforms. For B2B marketing and leadership, the five foundational metrics are AI citation rate, share of model voice relative to competitors, citation sentiment and accuracy, branded search volume lift, and AI-influenced pipeline. Dashboards that omit the pipeline connection are not used by leadership beyond the initial review.
How often should AI citation metrics be tracked and reported?
Monthly tracking of a consistent prompt set across priority platforms, with quarterly reporting to leadership that presents trends rather than point-in-time snapshots. Given that 40 to 60% of AI citations change month-over-month, weekly snapshots produce more noise than signal. Monthly averages with directional trend arrows, flagging changes that persist across two consecutive periods, are the reporting format that leadership can act on.
What is Share of Model Voice and how is it calculated?
Share of Model Voice is your citation count as a percentage of all brand citations across all vendors mentioned for your priority prompt set. Calculation: run your standard prompt set across the priority platforms, log every brand mentioned in each answer, total all brand mentions, and calculate what percentage of those mentions reference your brand. This is the competitive metric that contextualizes your absolute citation rate and answers the QBR question "how do we compare to competitors in AI search."
How do you connect AI search visibility to pipeline without direct attribution?
The most accessible proxy is branded search volume lift. When AI citation rates increase, buyers who encountered your brand in AI answers subsequently search for your brand directly, which shows up as increased branded search volume in Google Search Console within 30 to 60 days. This correlation is not perfect but is measurable, directional, and does not require new tooling for teams already tracking GSC. Self-reported attribution on demo request forms ("How did you first hear about us?") captures additional signal from buyers who are aware enough of their own research behavior to report it.
What is the Revenue Visibility Gap metric for AEO reporting?
The Revenue Visibility Gap is the estimated pipeline value of the difference between your current AI citation rate and a category-leading citation rate for your highest-commercial-intent query clusters. It is calculated by modeling: if category leaders are cited in 45% of relevant buyer queries and we are cited in 9%, what is the pipeline impact of that 36-point gap given our average deal size and lead-to-close rate? This translates AI visibility into a number that finance and the board recognize as a business risk rather than a marketing metric.
References
- NAV43, AEO GEO Dashboard: Executive Framework for AI Search Visibility, five-metric framework and pipeline connection
- PBJ Marketing, KPIs to Track for GEO and AEO Performance 2026, citation rate benchmarks and share of voice calculation
- HubSpot, AEO Metrics Every Marketer Should Track 2026, sentiment tracking and share of voice methodology
- Conductor, AEO and GEO Benchmarks Report 2026, 87.4% ChatGPT AI referral traffic share
- Lynkdog, AEO and GEO Industry Report 2026, 40-60% monthly citation drift, pipeline ROI data


