
The meeting usually goes like this. Marketing brings a slide with traffic up 40%, organic sessions up 27%, and newsletter subscribers up 15%. The CFO asks what that means for revenue. Marketing says it is hard to attribute directly. The CFO nods in a way that is not entirely charitable, and the budget conversation moves to channels with cleaner numbers. Content marketing gets defended on vibes and strategic importance rather than math. This is winnable. It requires doing the math.
What Is Content Marketing ROI and Why Is It So Hard to Measure?
Content marketing ROI is the revenue return on your content investment, expressed as a percentage: revenue attributed to content minus total content costs, divided by total content costs, times 100. The formula is not complicated. The attribution is.
B2B buying cycles last four to eighteen months on average and involve six to ten decision-makers who each consume different content at different stages. A CFO who reads your ROI calculator in May did not discover your company that day. A CTO who downloaded a technical white paper in February may have been the person who actually built the business case that put you on the shortlist six months later. Last-click attribution credits the demo request form. The content that built the case over six months shows up in the data as zero.
This is why 56% of B2B marketers say connecting content to ROI is difficult, and 47% do not measure it at all. Not because the ROI is not there, SEO-driven B2B content averages 748% ROI over three years and a 7-month breakeven according to First Page Sage's 2026 analysis, but because the measurement infrastructure to prove it is missing at most companies.
The Three-Layer Framework That Makes This Defensible
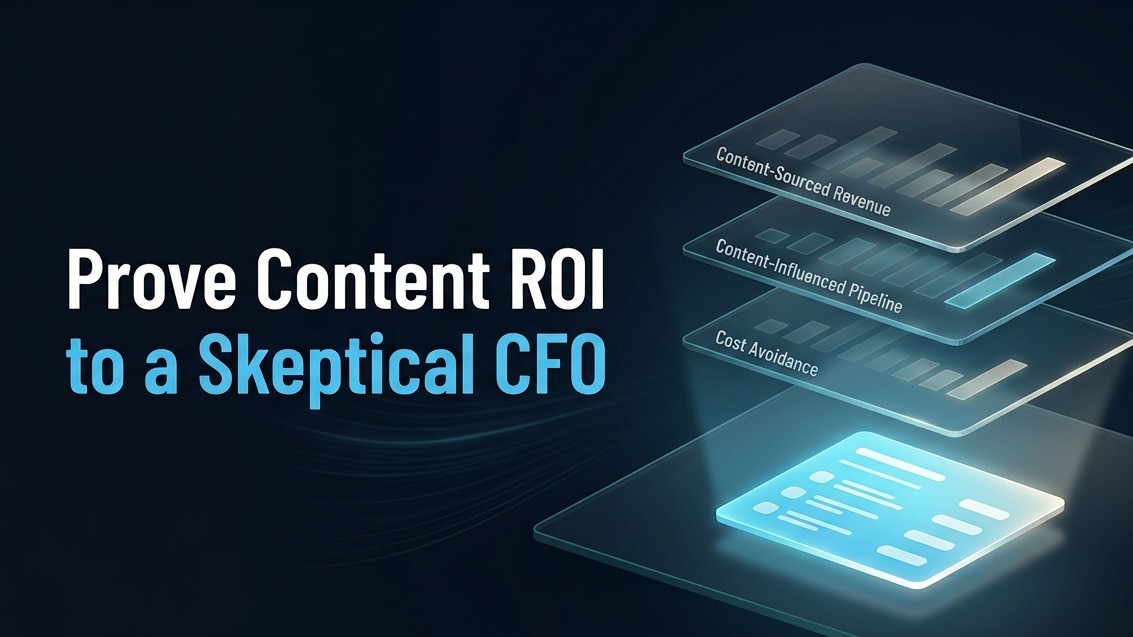
Here is the model that holds up in front of a CFO because it separates three different things that content does, measures each one honestly, and adds them together.
Layer one: content-sourced revenue. Deals where content was the first touchpoint that brought the buyer into your funnel. A prospect who found you through an organic search on an article, filled out a form, and eventually bought. This is the cleanest, most defensible number. It is also usually the smallest of the three layers. Track it in your CRM with a "first touch source" field and a UTM discipline that does not break every time someone shares a link.
Layer two: content-influenced pipeline. Deals where at least one contact engaged with content at some point before converting, regardless of whether content was the first or last touch. This number is always larger than layer one and reflects content's role in building the trust that made the deal closeable. Track it with CRM contact time visibility: which contacts in a closed-won deal engaged with which content assets, and when. Companies that implement proper attribution discover that content influences twice as many conversions as basic analytics suggest.
Layer three: cost avoidance. Content marketing costs 62% less than traditional marketing per lead, according to current benchmarks, and those leads close at 14.6% versus 1.7% for outbound. The CFO does not have to like content marketing to respond to "we generated 847 marketing-qualified leads at a cost of $38 each, versus $212 for our paid channels." Calculate the cost-per-qualified-lead from content versus your next-most-cost-effective channel and present the gap.
Add all three layers together. That is the number you bring to the CFO conversation.
The One Metric That Changes the Budget Conversation
Content-attributed pipeline as a percentage of total pipeline. If your content generates 30% of your company's pipeline at 60% lower cost per qualified lead than paid acquisition, you do not have a marketing budget conversation. You have a business case.
This metric has two virtues. It is in the CFO's language, pipeline percentage is a number the board sees, and it is honest. It does not overcount by claiming last-click credit for everything. It simply says: here is the share of your revenue engine that content is feeding, and here is what it costs per dollar of pipeline generated versus your alternatives.
Getting to this number requires connecting GA4, your marketing automation platform, and your CRM in a single view with consistent UTM parameters. That is a one-time setup problem, not an ongoing measurement problem. Once the pipes are connected, the metric updates itself.
The AI Search Visibility Layer Most CFOs Have Not Seen Yet
Here is a newer dimension that belongs in the ROI conversation and that most CFOs have not been shown yet. AI search citations do not always generate a direct click. A buyer who asked ChatGPT about your category and got an answer citing your company may have visited your site through branded search three weeks later, or not at all before the sales conversation. That attribution path is invisible in last-click or even multi-touch models.
The leading indicator for this is branded search lift. When your content earns AI citations, branded search volume for your company increases as a lagging result, because buyers who see your name in an AI answer later search for you directly. If your branded query volume is increasing quarter over quarter and you are running an active content and AEO program, that increase is at least partly attributable to AI search visibility, even if you cannot draw a straight line from citation to deal.
Add it to the CFO presentation as a leading indicator, not as claimed revenue. "Branded search queries up 34% year over year, which we attribute partly to increased AI citation share" is a specific, honest claim about what AI-optimized content is doing that no vanity metric can make.
The Attribution Model You Are Probably Getting Wrong
GA4 has deprecated the older first-click, linear, time-decay, and position-based attribution models. What remains is data-driven attribution and last-click. Data-driven attribution uses your own property's data to estimate how each touchpoint changed conversion probability. It is more accurate than anything that came before it for teams with sufficient conversion volume. Last-click systematically undercredits content that influenced deals early in a six-to-eighteen-month cycle.
The practical fix: use data-driven attribution in GA4 for your standard reporting, supplement it with CRM pipeline influence tracking to catch the multi-stakeholder paths GA4 cannot see, and use a 90-day to 12-month attribution window for SEO-driven content, not a 28-day window built for paid campaigns. A 28-day window on a B2B content program misses most of the deals the content influenced.
What to Bring to the Meeting
One page. Four numbers.
Content-sourced pipeline this quarter, in dollars. Content-influenced pipeline this quarter, in dollars. Cost per content-qualified lead versus cost per qualified lead from your next-most-efficient channel. Branded search volume change year over year, as a leading indicator.
That is the conversation. Not traffic. Not page views. Not subscriber counts. Four numbers that connect content to pipeline, cost efficiency, and AI search visibility in language that maps directly to how the CFO thinks about investment returns. The ROI is there. The 748% average over three years is real. The job is building the measurement infrastructure to prove it.
Frequently Asked Questions
What is the right formula for calculating content marketing ROI in B2B?
Content marketing ROI equals revenue attributed to content, minus total content costs including labor, tools, and overhead, divided by total content costs, multiplied by 100. The formula is simple; the challenge is accurately defining "revenue attributed to content" across a multi-touch B2B buying cycle. The most defensible approach combines three revenue streams: content-sourced revenue where content was the first touch, content-influenced pipeline where content appeared anywhere in the buying journey, and cost avoidance calculated by comparing cost-per-qualified-lead from content versus other channels.
Why do most B2B content marketing teams struggle to prove ROI?
The core problem is attribution architecture. Last-click attribution credits the final touchpoint before conversion and systematically undercredits content that built awareness and trust over a four-to-eighteen-month buying cycle. Compounding this, most companies lack the CRM integration needed to track content touchpoints across all contacts in a buying group, not just the primary contact who converted. The result is that content shows up doing far less work than it actually does, because the measurement model was built for paid advertising, not for organic content influence over long cycles.
What is a good content marketing ROI benchmark for B2B technology companies?
First Page Sage's 2026 analysis puts SEO-driven B2B content at 748% average ROI over three years with a seven-month breakeven, and B2B SaaS specifically at 702% ROI. The industry-level benchmark for content marketing broadly is approximately $7.65 returned per dollar spent. These are directional averages across diverse companies and should be treated as reference points rather than guarantees, actual returns depend heavily on average deal size, content quality, and whether the measurement infrastructure is in place to capture influenced revenue.
How does AI search visibility factor into content marketing ROI reporting?
AI search citations increasingly influence buyer research before any trackable click occurs, which means some of content's value in AI search environments does not appear in standard analytics. Branded search volume lift is the most accessible leading indicator: when content earns AI citations, branded search queries typically increase as a lagging effect, because buyers who encounter your brand in an AI answer later search for you directly. Reporting branded search volume change alongside traditional attribution metrics gives the CFO a more complete picture of how content builds pipeline awareness, even where direct attribution is not possible.
What attribution window should B2B content programs use in GA4?
90 days at minimum for most B2B content programs, and 6 to 12 months for companies with longer buying cycles or SEO-driven content strategies targeting high-consideration keywords. GA4's default 30-day window was built for paid advertising with short conversion paths. Applying it to B2B content marketing systematically undercredits content that influences deals forming over months. Set a custom attribution window in GA4 that matches the average length of your sales cycle, and use data-driven attribution rather than last-click for the most accurate representation of how touchpoints contributed to conversion.
References
Revenue Memo, Content Marketing ROI Statistics 2026, 748% SEO ROI, 56% attribution difficulty, 36% can accurately measure: https://www.revenuememo.com/p/content-marketing-roi-statistics B2B Contentos, B2B Content Marketing ROI 2026, three-layer measurement framework: https://b2bcontentos.com/b2b-content-marketing-roi/ Digital Applied, Content Marketing Statistics 2026, 3.1x budget growth for teams that track attribution: https://www.digitalapplied.com/blog/content-marketing-statistics-2026-data-points Directive Consulting, B2B Content Marketing ROI Measurement, AI search and dark funnel attribution: https://directiveconsulting.com/blog/blog-b2b-content-marketing-roi-measurement/ Impactful Identity, Prove Content Marketing ROI 2026, GA4 attribution window guidance: https://www.impactfulidentity.com/how-to-measure-prove-and-maximize-the-roi-of-content-marketing-2026/


